
Duet3D FDM Anomaly Detection Research
This project was carried out by Yasas Wijetilake as a part of his master’s programme in AI & Robotics. Conceptually it started as a continuation of some of Duet3D's early work and has also been inspired by other research such as 1, 2, and 3.
Duet3D’s original work uses a 2D, top down approach, comparing images with G-code renders layer by layer. However, this approach is relatively slow as the camera needs to capture multiple images directly from the top of each layer taking time to pause the print, move the head away, and to build up an array of images. It also relies on mounting a camera as a separate tool or otherwise to the printer gantry, rather than having a side view used commonly for 3d printer timelapses.
The research focus is based on rendering an image of an object from a G-code file and comparing it to the actual print in real time to detect print anomalies. The idea was to generalise anomaly detection where an anomaly is defined as any instance the actual print is different to the expected output in the G-code.
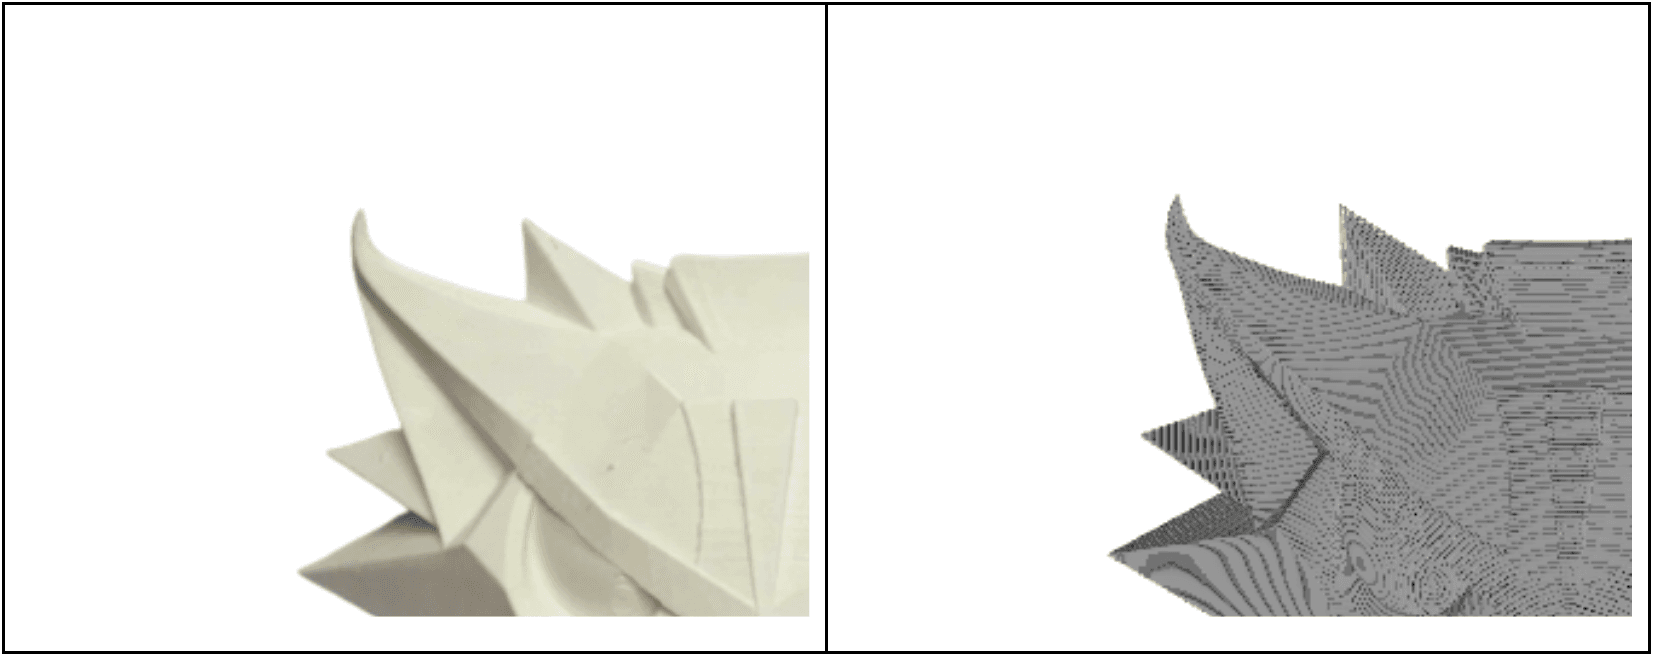
For example, the following shows a sample image and its rendered G-code from the same camera poses at the same layer height and bed position.
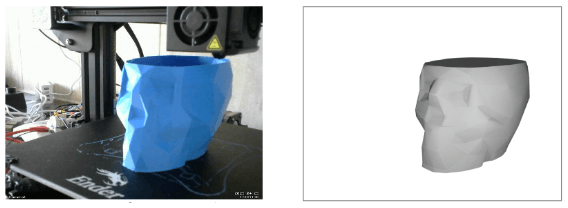 Low Poly Skull Vase model by Domi1988
Intuitively the G-code provides information about the correct outcome. What we found surprising was that the current anomaly detection tools we looked at are not using this information. Most tools are equipped with machine learning algorithms that were trained only to detect a specific type of error or errors, summarised as unwanted extrusion or "spaghetti". These approaches are really good at being resource efficient and fast. However, they can be ineffective at times when the print has gone wrong with none of the anomalies for which the algorithm was trained are there. For instance when there are significant dimensional inaccuracies without any spaghetti, the algorithm may fail to notice that there is an anomaly.
We sought to discover if a more generalised approach for 3D print anomaly detection, using the G-code toolpaths, was practical to implement.
The tools/approaches that were used to verify this idea are as follows:
A. Prerequisites
| Item | Used Approaches/Devices/Tools |
|---|---|
| A 3D printer with a network interface to read coordinates (XYZ) | Ender 3 printer equipped with RRF and a Duet3D board |
| A calibrated/pose estimated camera setup used for imaging of 3D prints | Raspberry Pi/MotionEyeOS connected Logitech C270 (640x480 streamed) |
| A tool that can recreate a digital twin of the image from the camera using the G-code file and printer XYZ parameters | Blender for rendering and visualising; Blender headless for rendering and ThreeJS for visualising |
| An algorithm that can compare two images of the same print and determine if there are any anomalies | Machine learning - Siamese Networks |
B. Conceptual Workflow
- Start the print
- Upload the G-code into the anomaly detection tool
- Read real-time print coordinates from the Duet using the HTTP interface
- Capture an image from the camera
- Recreate a digital twin image
- Perform extra processing on the images (background removal etc)
- Compare these two images and determine if there are any 3D print anomalies
There are many methods to perform image comparisons, for instance, approaches such as measuring the Euclidean distance between raw pixel intensities can be effective in the case of a simple task.
For a complex task such as comparing images of an actual print and a digital render taken under varying lighting conditions and imperfect pose-estimations, an approach involving machine learning is far more suitable. Therefore an approach based on Siamese neural networks, an architecture that can be used for comparing two images to retrieve a similarity measure between them, was chosen.
Siamese Networks
Siamese networks use multiple (2 or 3 depending on the case) parallel sub-networks consisting of feature extraction layers (usually a CNN-convolutional neural network model). The outputs from each branch are used for determining the image similarity between the input images using a loss function such as “contrastive loss”.
The following figure is of a Siamese network with 2 subnetworks.
 Siamese Network with 2 subnetworks
As shown in the above example, actual and rendered images (preprocessed) can be the inputs of this Siamese network.
Dataset
As the method was to train a machine learning model following the Siamese architecture, a dataset with matching image pairs was needed for the neural network to learn weights to find a correlation between an anchor image and a candidate image. So far 3 datasets have been constructed using images of actual 3D prints and their corresponding G-code. In this post, we will be discussing the first two datasets.
Source Images
For the creation of the dataset, images were sourced both by printing and from images of prints available in the community. Image renders were generated using the model G-codes, constructing an image pair with the same camera pose.
When creating the dataset, multiple images taken from different angles of each model were used. An intuitive approach of creating a dataset would be to capture multiple images of the print while in progress, in a similar manner to how the model would be used when deployed. However this approach was not taken as there is a risk of imparting unwanted bias as early parts of the print would be added many times, whereas later parts would be added less frequently.
Image Augmentation
Image augmentation processes were performed by splitting and rotating the images to increase generalisability and the ability to discover anomalies in a focused area. The source images (both actual and render) were divided into 2x2, 4x4, 8x8 segments so the network can capture and train to identify anomalies at different resolutions. (For example, during an actual print as the bed moves close to and away from the camera, the size of print in the image will not be consistent). This provides the ability to make comparisons of much smaller areas of the print instead of comparing the whole print at once.
Image Resolution
Once the images were augmented, they were of different resolutions but in general above 100x100. The image size for training was chosen as 100x100 pixels for each dataset and the augmented images were scaled down to this resolution.
A higher image resolution such as 100x100 allows for a substantially higher level of detail in data relative to a 24x24 or 48x48 image. For instance, image sizes such as 24x24 can lead to significant information loss during the downscaling process. However, 100x100 retains more of the original image's context and content allowing the capturing of fine details which can be valuable when identifying subtle differences. Moreover, this can lead to more accurate similarity assessments, reducing the likelihood of false positives or negatives.
Summary of the datasets
| Dataset | Image pair count | G-code render method | Model reference list |
|---|---|---|---|
| v1 | 1455 | Blender | Ananas Vase; London Telephone Box; Radcliffe; Torre de Belem; Chromatic Vase; Lattice Bowl |
| v2 | 3168 | Blender/ThreeJS | Crag Vase; Lattice Bowl; Minion Pot; Owl Pot; Darth Vader Holder; Darth Vader Bust; Moa Vase; Zephyr Vase; Cat; Tiki Mug |
Dataset v1 (1455 image pairs) This version of the dataset was built using Blender and manually aligning with the actual image of workpieces. This approach was used to quickly meet the academic timelines, disregarding the lack of scalability of the approach.
- Gathered available images of 3D prints and remove its background
- Gathered respecting G-codes/if not STLs and slice it
- Used Blender to create a render, manually align it with the image and take a snapshot
- Created images pairs one of which is the background removed image of the actual 3D print and the other a snapshot of the G-code render
- Augmented data (splitting, rotating, flipping) and creating 100x100 images
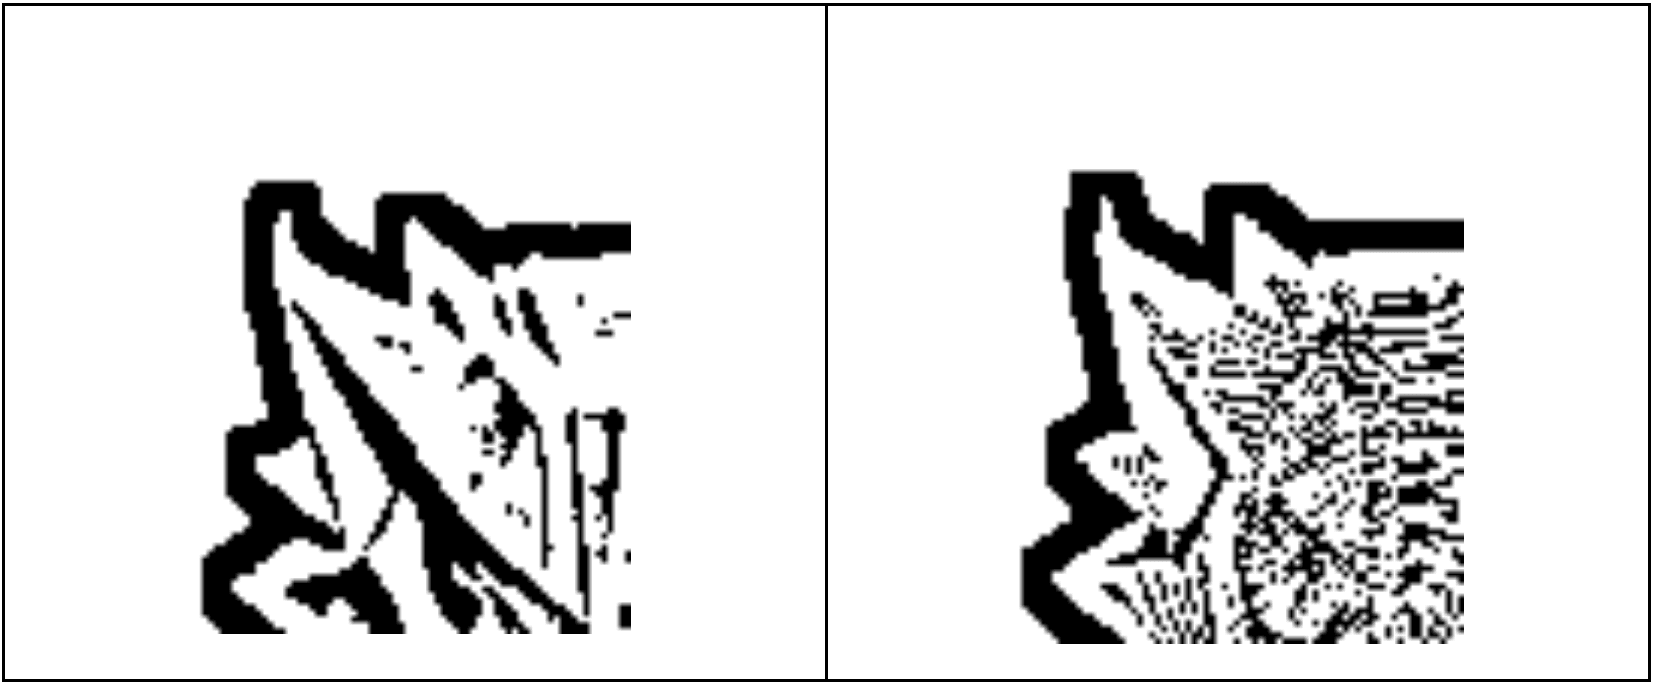
- Filtered out noise and extracting lines/contours of the dataset (both actual and rendered)
Dataset v2 (3168 image pairs) When building this dataset the previous freehand approach was replaced with the workflow that follows later in this blog. This allowed much easier parametric manipulation of the 3D model’s poses to align with the actual image. Despite the ease, there are still some manual steps involved as custom images were used instead of creating the dataset from calibrated-printer camera images
- Gathered available images of 3D prints and remove its background
- Gathered respecting G-codes/if not STLs and slice it
- Used Blender to create a GLB file which was later imported to the Web app which used ThreeJS, manually align it with the image and take a snapshot
- Create images pairs one of which is the background removed image of the actual 3D print and the other a snapshot of the G-code render
- Augment data (splitting, rotating, flipping) and creating 100x100 images
- Filter out noise and extracting lines/contours of the dataset (both actual and rendered)
ML Model
When using Siamese networks it is possible to leverage well-known architectures such as Resnet, VGG and use their pretrained weights. This approach often is preferred as with pretrained models it is only needed to customise the model for the task. In our case we compared a ground up design with an architecture based on Resnet. Keras with TensorFlow backend was used as the library of choice due to familiarity with these tools.
Model Overview
| Ground up Design | Pretrained Resnet | |
|---|---|---|
| Trainable parameters | 86,117 | 25,893,521 |
| Used pretrained weights | No | Yes |
| Number of channels the model requires | 1 | 3 |
| Number of actual channels in data | 1 | 1 * |
*Since we've used contours, the images have only black and white channels. So those channels were duplicated into two more channels with the same information.
The code for these models will be provided in a future blog post.
Workflow
The models described in the previous section needed to be integrated into a workflow for detecting anomalies in real-time from a video/series of still images.
This workflow was constructed as a web application where a browser-run client application sends images of the workpiece and the digital twin to the backend which then performs anomaly detection tasks and returns a labelled image. The backend was also used for returning a rendered GBL file of the G-code upon request.
The browser-run client application was developed with a printer/camera calibration and anomaly detection features. These two are detailed below.
Calibration
One of the prerequisites of this project was to have a pose estimated camera. The initial attempt was to lay a calibration pattern such as a checkerboard (OpenCV-Github) on the print bed and calculate the pose and position of the camera with respect to a fixed point on the printer. However, this task required too many manual measurement steps so a simpler and a more reliable method was developed using a three-part calibration sequence.
- Calibration Print: Print a provided calibration model such as test_model.stl
- Pose Estimation: Using the web app calibrate and download the partial config file
- Base Height Estimation: Also using the web app, calibrate and download the full config file
 Calibration Step 1 - Pose Estimation
 Calibration Step 2 - Base Height Estimation
Anomaly Detection
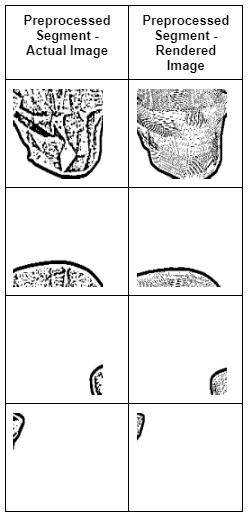
First the area of interest in the image was divided into much smaller segments for increased resolution. Anomaly detection was then performed on each segment, where the similarity score was assigned. If the score was greater than 0.5, it was considered as similar, while one below 0.5 was considered to have an anomaly. (The value 0.5 was chosen as it was when the actual results aligned mostly with the expected outcome, anomaly/not an anomaly, of the model as opposed to 0.3 and 0.7 which yielded more false positives and missed true positives respectively.)
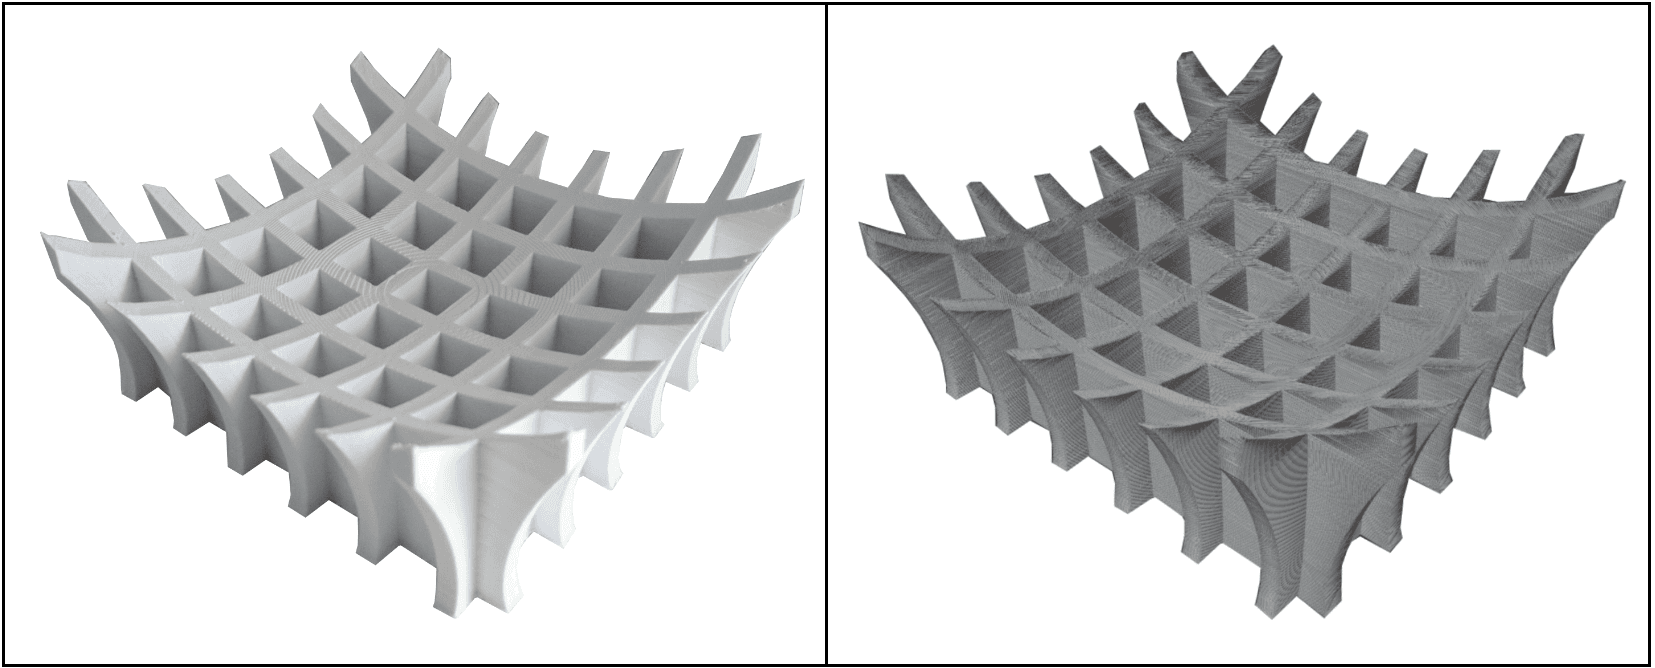
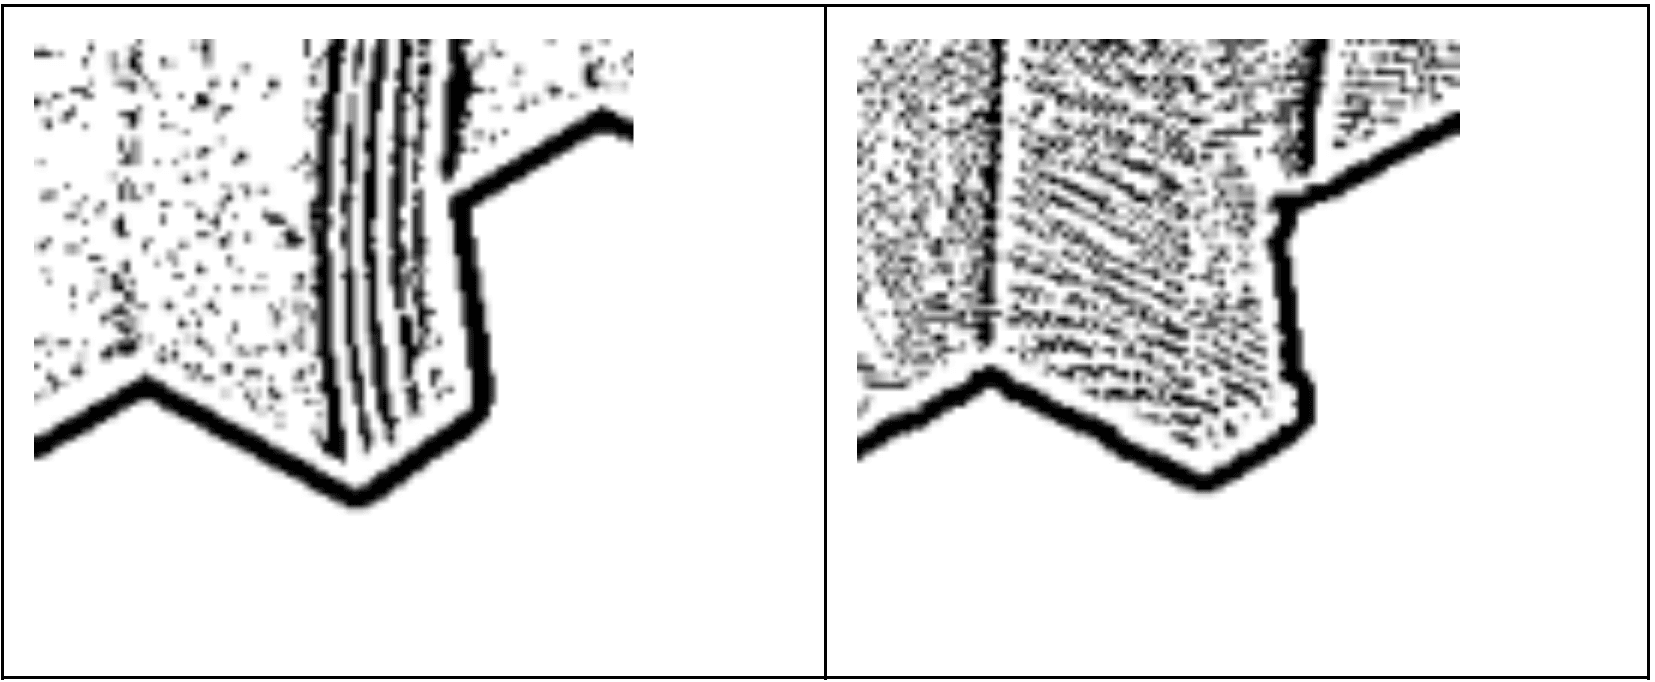
The following are a series of such segments from the actual and rendered image pairs.
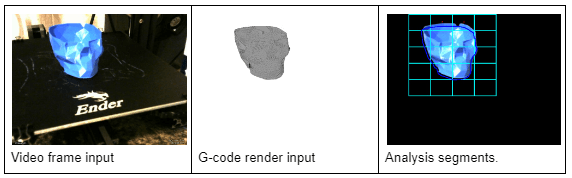
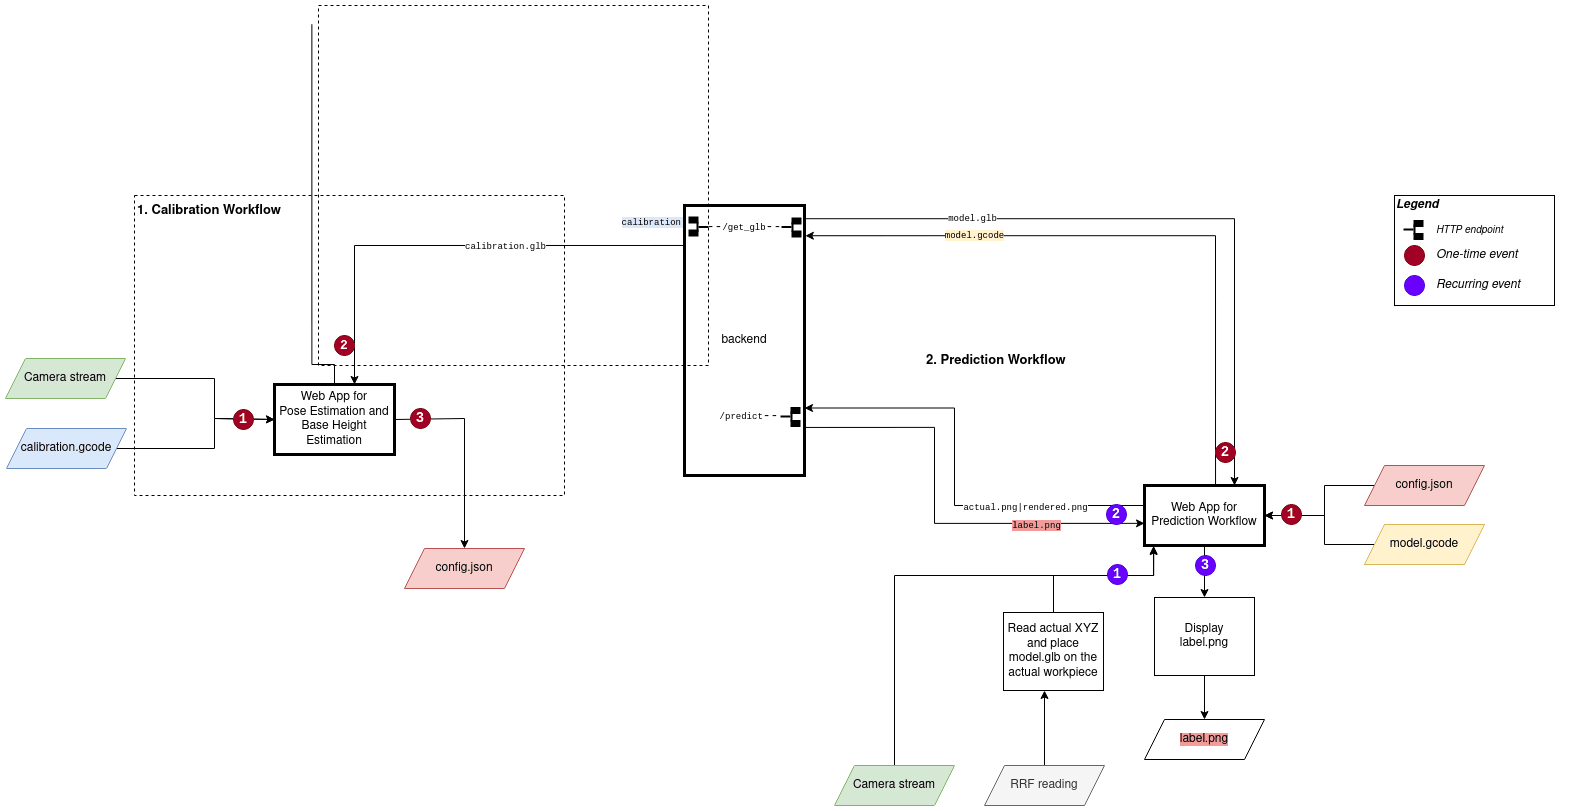
Overall Anomaly detection workflow
Performance
The previously discussed models were trained on different datasets and evaluated using augmented test data and against an actual print timelapse.
The test dataset was augmented using the images from the same dataset and rotating them to ensure that the data was not seen by the model previously while maintaining the overall tone of the data.
For the real-world test scenario, a pre-recorded timelapse with image pairs was used.
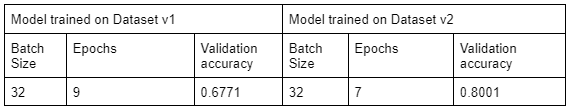
Performance of the model built from scratch
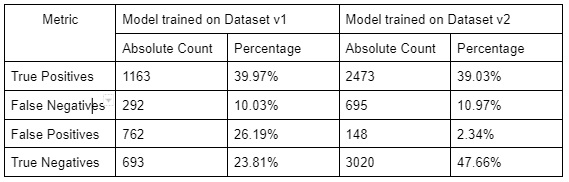
Breakdown of the performance

Performance of the Resnet-50 Pretrained Model

Breakdown of the performance
Comparison between models
- When tested using the augmented data, model trained on Dataset v2 performed better
- The model trained on Dataset v1 performs worse when tested against the real timelapse than when tested on augmented data as there are more False Positives (Detected as anomalies where there’s none) than True Positives (Detected as anomalies where there actually are).
- When the models trained on Dataset v1 and v2 are individually tested against the real print timelapse, the former seems to perform better.
Problems and Future Developments
G-Code Visualisation
Up to the point of creation of Dataset v2, the workflow heavily depended on Blender and a backend server to generate GLB files and visualising using ThreeJS. However, from the next iteration this is to be streamlined by using the visualiser developed by Juan Rosario and already integrated into Duet3D's Machine control UI: DuetWebControl.
Resuming upon Browser Crashing/Closing
As the current workflow is browser-dependent, in the event the browser crashes or closes, the user has to reload the calibration configs and resume the process manually.
Dependency on a Web Browser
The existing workflow is written as a web application, which means that a web browser must continuously run to perform anomaly detection. As the architecture requires a backend anyway to provide the analysis, this could be leveraged to provide headless functionality, as long as a suitable method to send the images to the backend and send control commands back to the printer was developed.
Sensitivity to Light Intensity Changes When Detecting Anomalies
When looking for anomalies, the AI model tended to find shadows or highlighted areas in the actual image with varying colour intensities as dissimilar to the digital render. This is a significant issue as it contributes to quite a bit of false positives.
Next Steps
This work is continuing and in a future blog post or posts we will describe the results with Dataset 3 and share the code for the ML models.
